Production Visualisation with ANDON Board Monitoring
With PROvis ANDON Board Monitoring, machine data with individual machine status, cycle monitoring, KPIs, job information and downtimes can be visualised simply and clearly. This is done in tabular form, using traffic lights or tachometers. Web-enabled content can be integrated in many different ways, e.g. .xml, .pdf, images, web pages, streamed .ppts / webcams or video.
You are currently viewing a placeholder content from YouTube. To access the actual content, click the button below. Please note that doing so will share data with third-party providers.
More InformationReal-time information in your individual dashboard
You are currently viewing a placeholder content from YouTube. To access the actual content, click the button below. Please note that doing so will share data with third-party providers.
More InformationInform and motivate employees at the right time
Content can be displayed at specific times and for a specific length. The screen sequence and duration of a layout can be individually scheduled.
Shop floor communication
Navigate and inform interactively through the layouts you create. Avoid many enquiries through active and organised information management.
You are currently viewing a placeholder content from YouTube. To access the actual content, click the button below. Please note that doing so will share data with third-party providers.
More InformationReplace the whiteboard or notice board with modern visualisation monitors
Visualise your production with ANDON Board Monitoring. Moving images make people more aware of information and take it in more actively.
Your benefits at a glance

Inform & motivate employees

Speed up processes

Share information quickly
Transfer content in just 2 steps
Communicate digitally by creating and customising your dashboard with multiple widgets and then transferring it to ANDON Boards in waiting and reception areas, presentation rooms, hall entrances, production, break rooms and canteens, warehouses or outdoor railings.
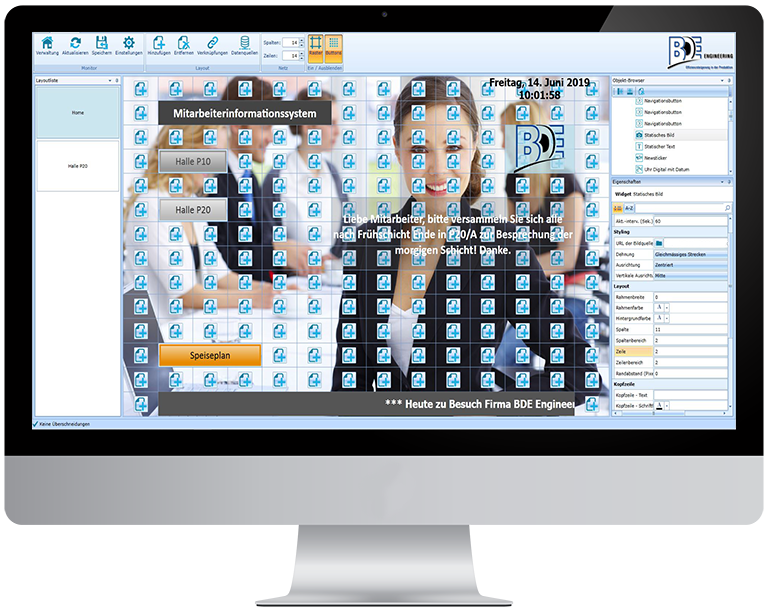
1. Create content online
You can easily create the content yourself. You use the modules to define which content is communicated in which place.
2. Transfer content directly to production
A LIVE transfer of your content takes place immediately after editing with the save process. For example, if you update an EXCEL document, PROvis will also transfer the update directly.
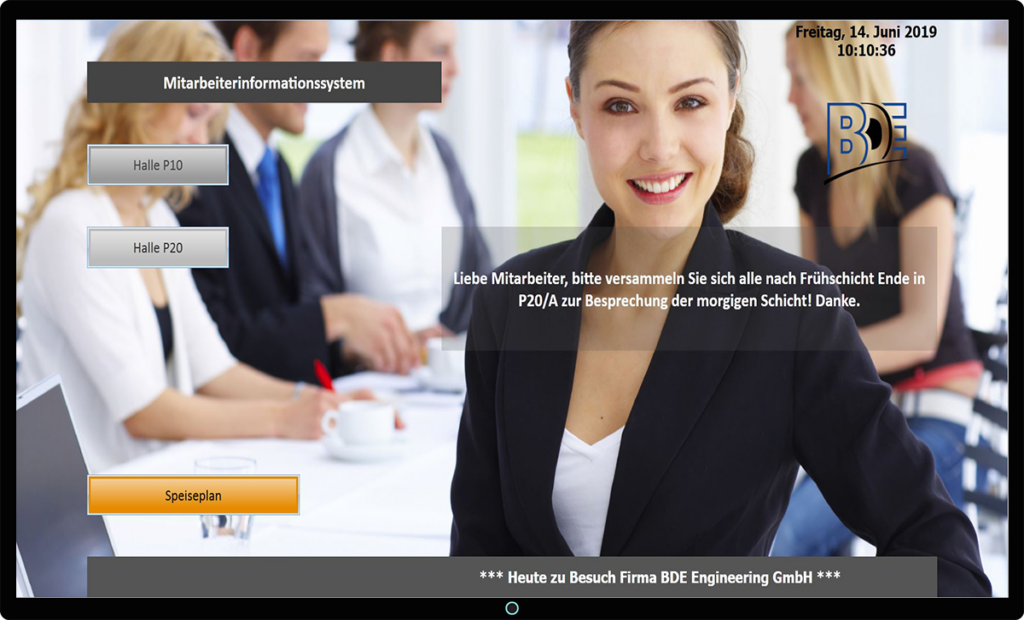
Visualisation as a key component of your Industry 4.0 strategy
All information in the value chain should be available and up-to-date at any time and in any place. PROvis ensures fast information transfer and thus provides real-time support at the shop floor level.
Features
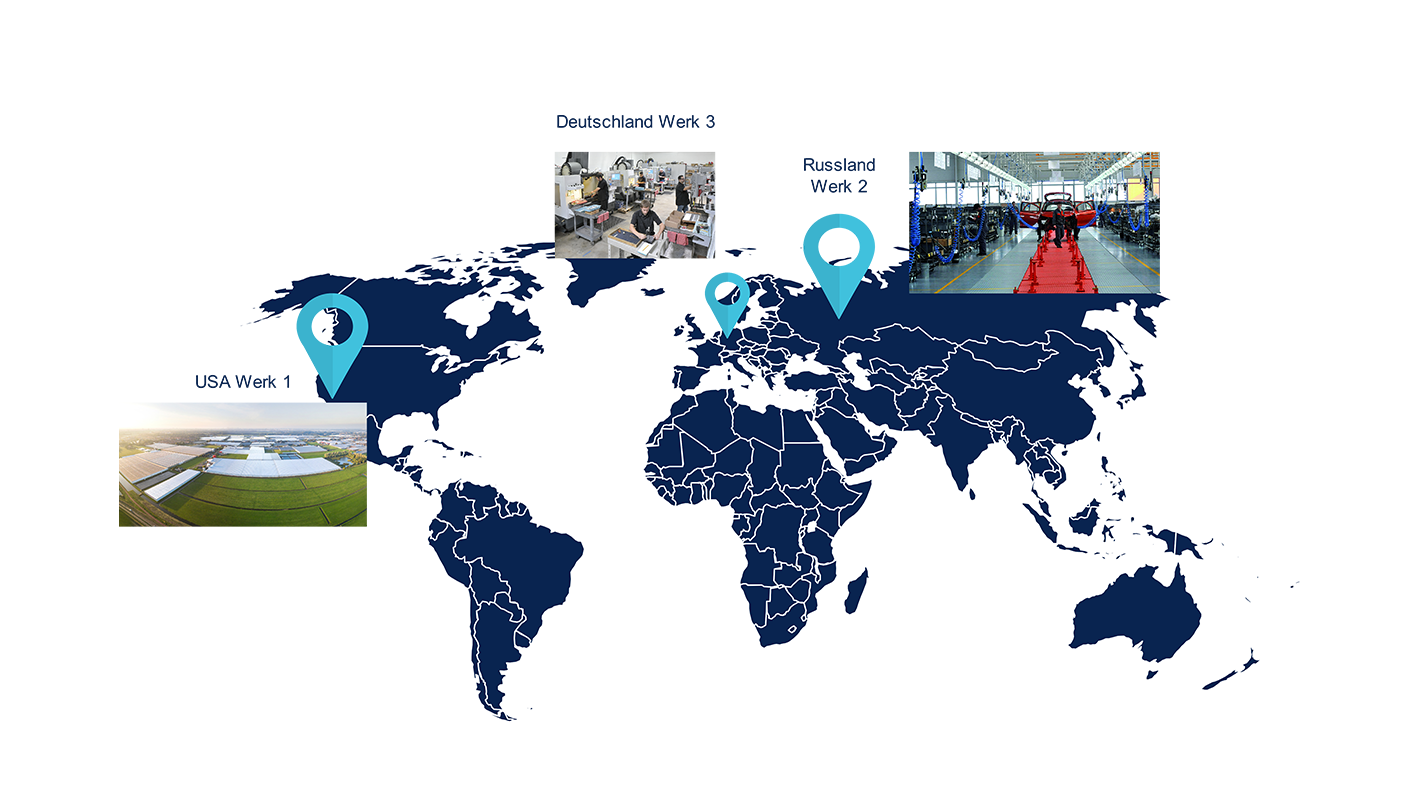
Worldwide transmission
Transmit and visualise plant and machine data and a wide range of other information live to any location in the world.
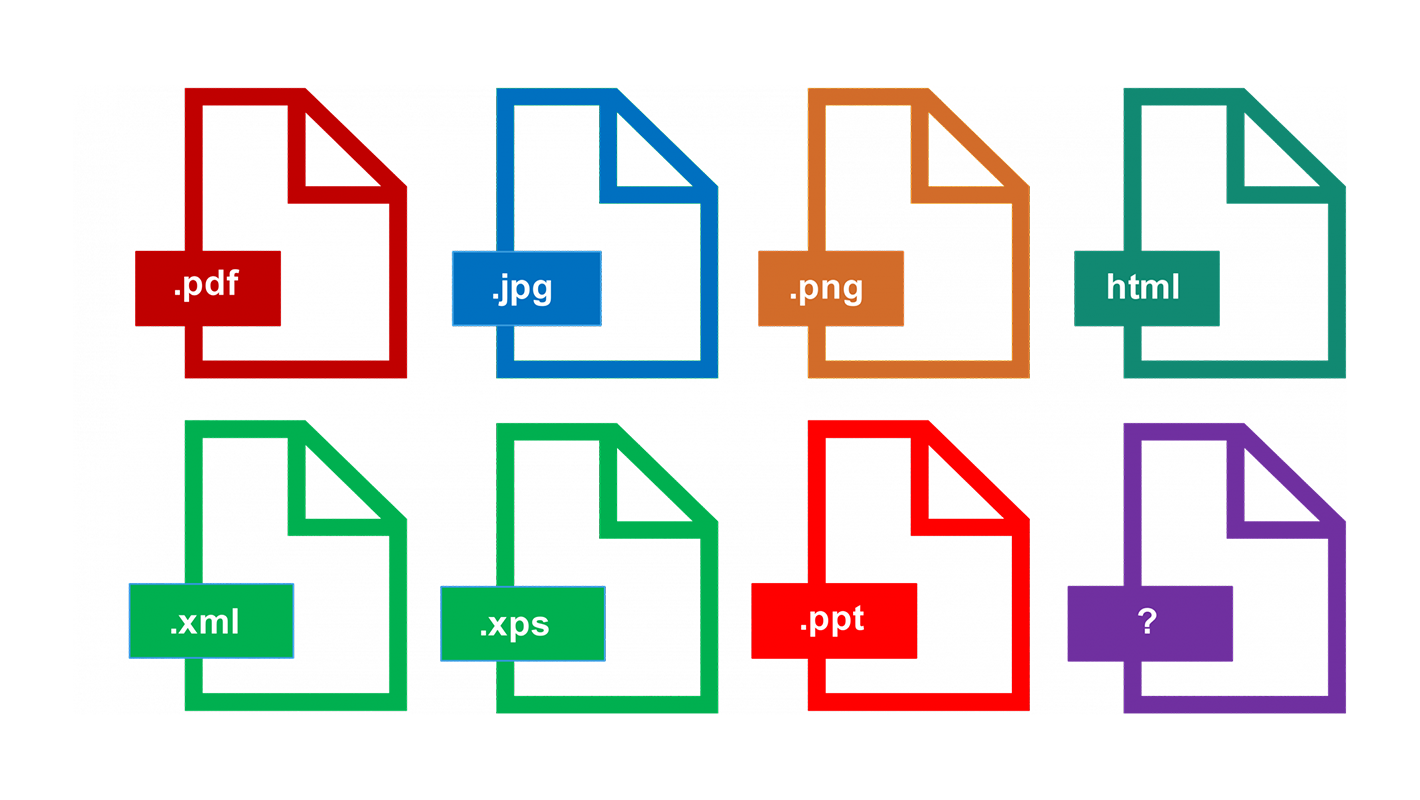
Integrate any file format
With this intelligent tool, a wide range of file formats can be integrated and visualised on large monitors with a few simple mouse clicks.

Interact with navigation buttons
Navigation buttons allow you to interactively navigate through the various levels by touch. This allows information to be visualized and accessed quickly and precisely from anywhere.
Monitor examples
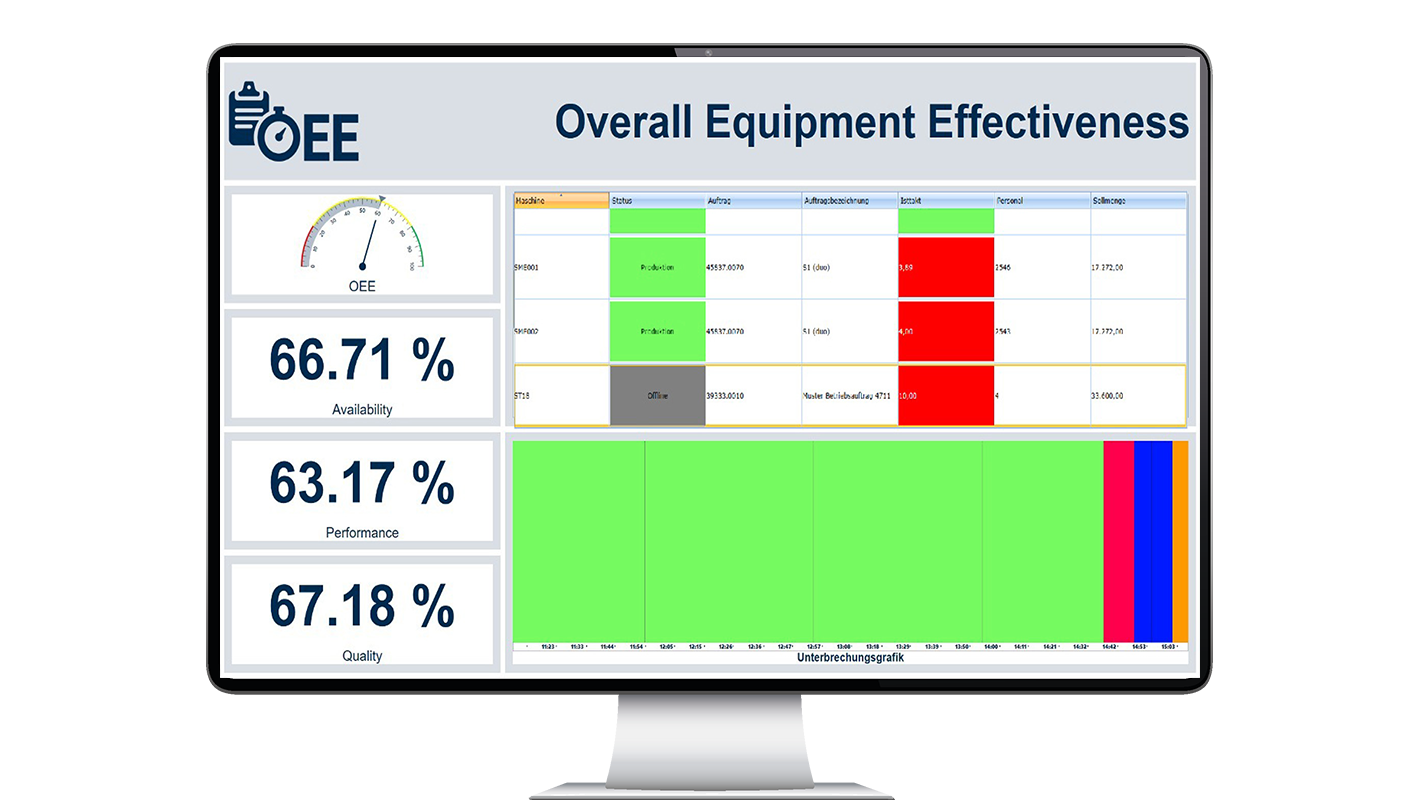
Visualisation of OEE and machine data
Our production visualisation with ANDON Board Monitoring gives you a detailed overview of your production processes in real time. You can see current OEE data, a comprehensive machine list and an interruption graph on the screen, helping you to monitor and optimise the efficiency of your production.
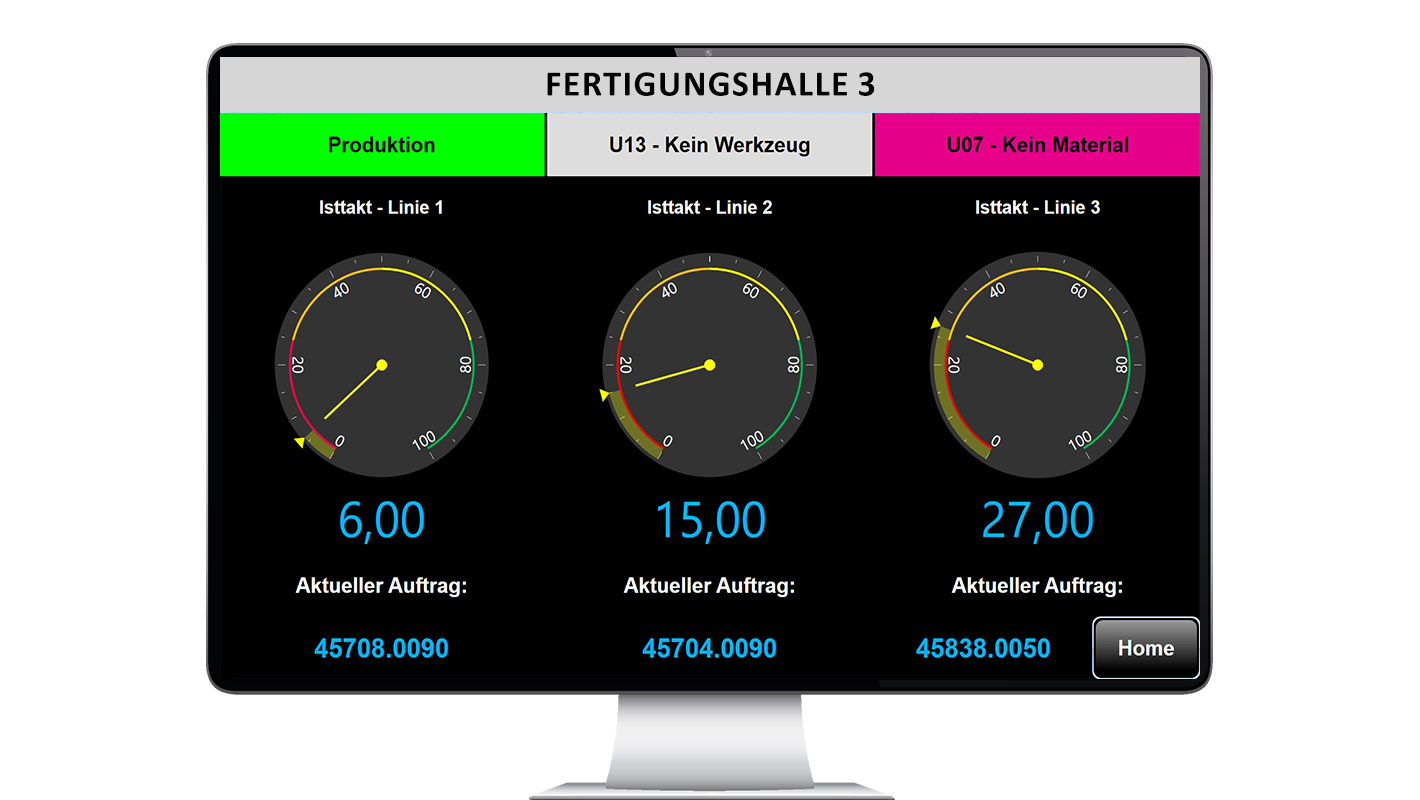
Production Lines and Order Status
Several tachometers are displayed on this screen, showing the actual cycle of the production lines in real time. Each tachometer is associated with a production line and an order. You can see at a glance how fast the line is working and whether it is meeting the set targets. The screen also shows the status of each machine.
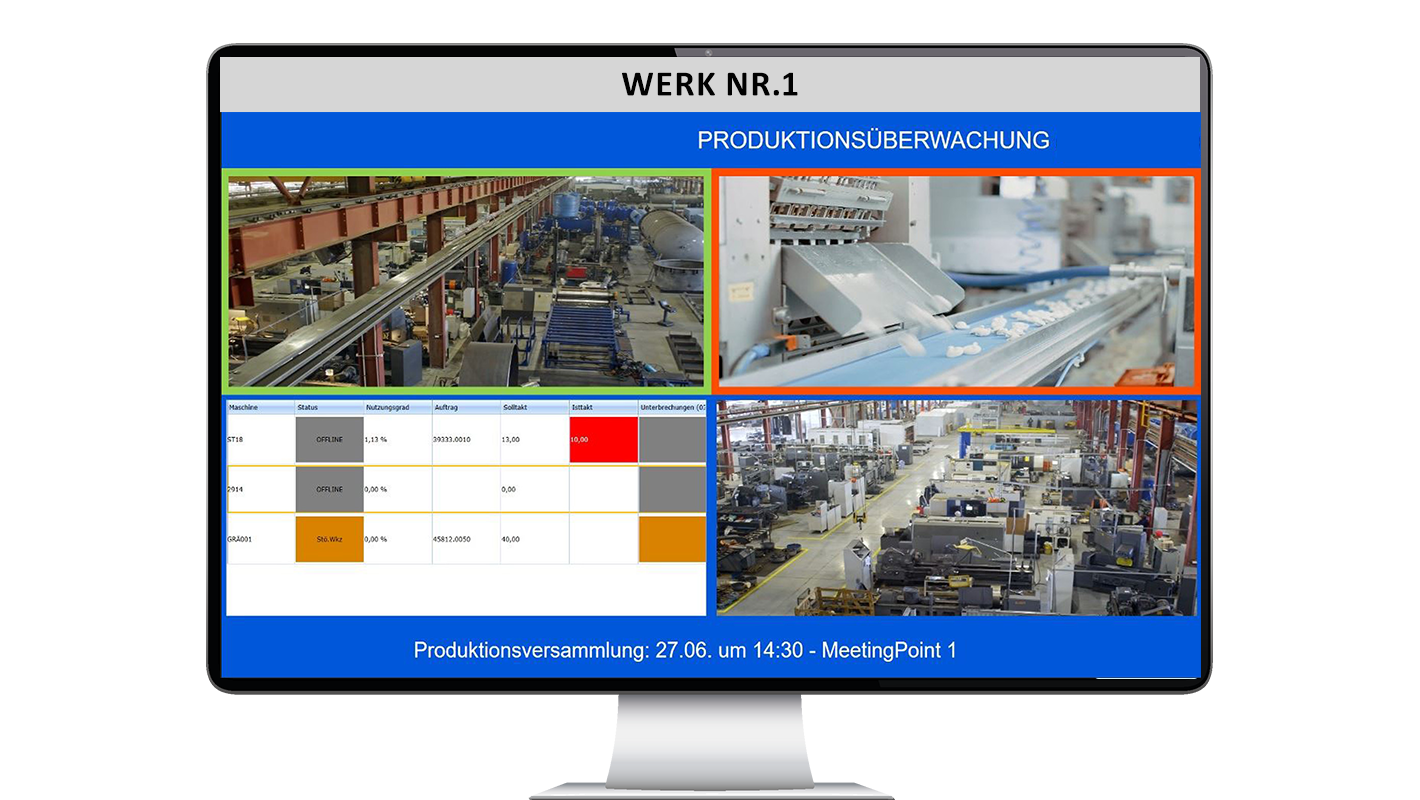
Production monitoring and worker communication
This screen combines real-time visual monitoring with key production data and employee information. Webcams show a selected part of the production, such as the production process or shop exits. A video of a machine visualises the current processes, while a machine list provides the relevant status information. The overview is complemented by an important message about a staff meeting.
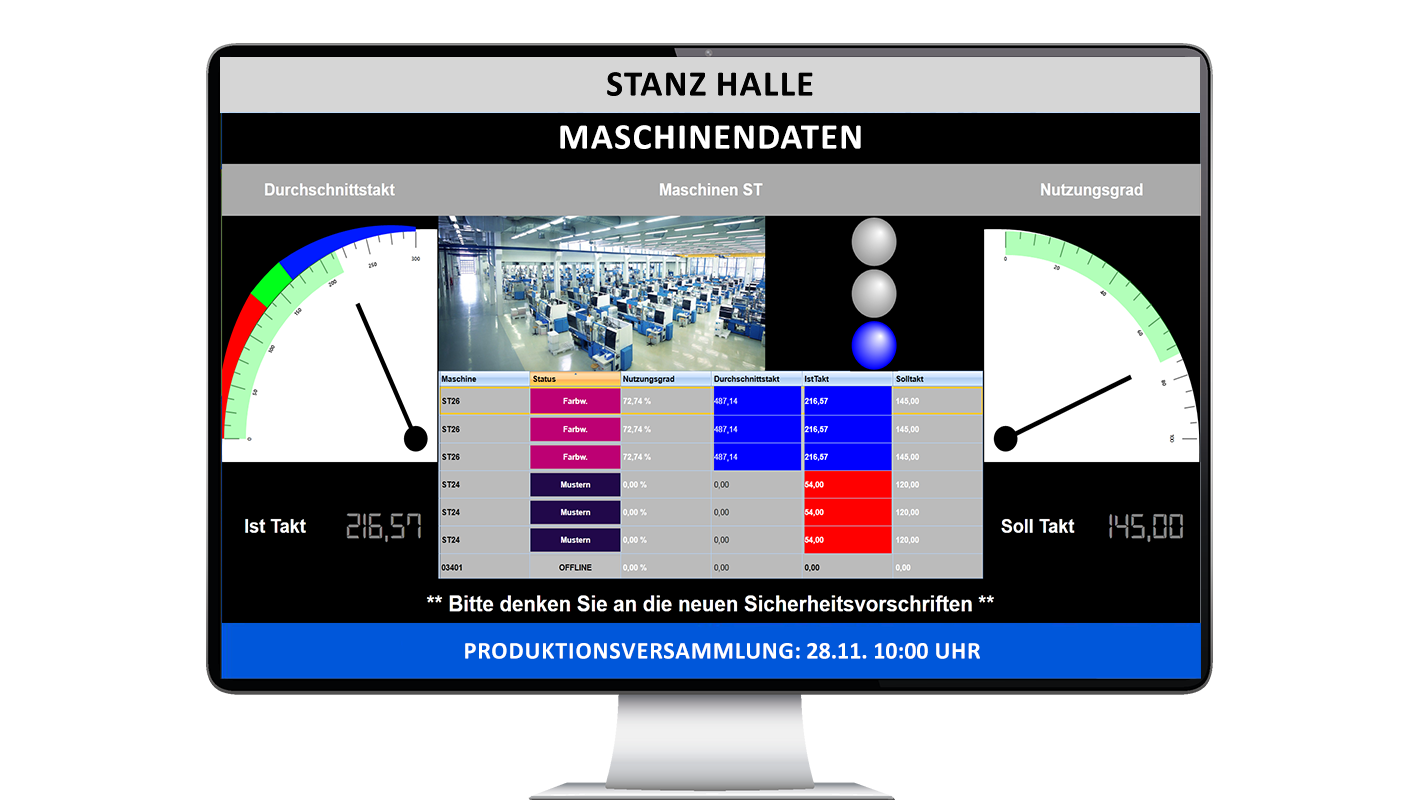
Production performance at a glance
This view shows the production progress and performance of your machines. Average cycle and utilisation are displayed in the form of a tachometer. In the centre is a machine list showing the status of each machine, supplemented by key metrics such as actual cycle and target cycle.
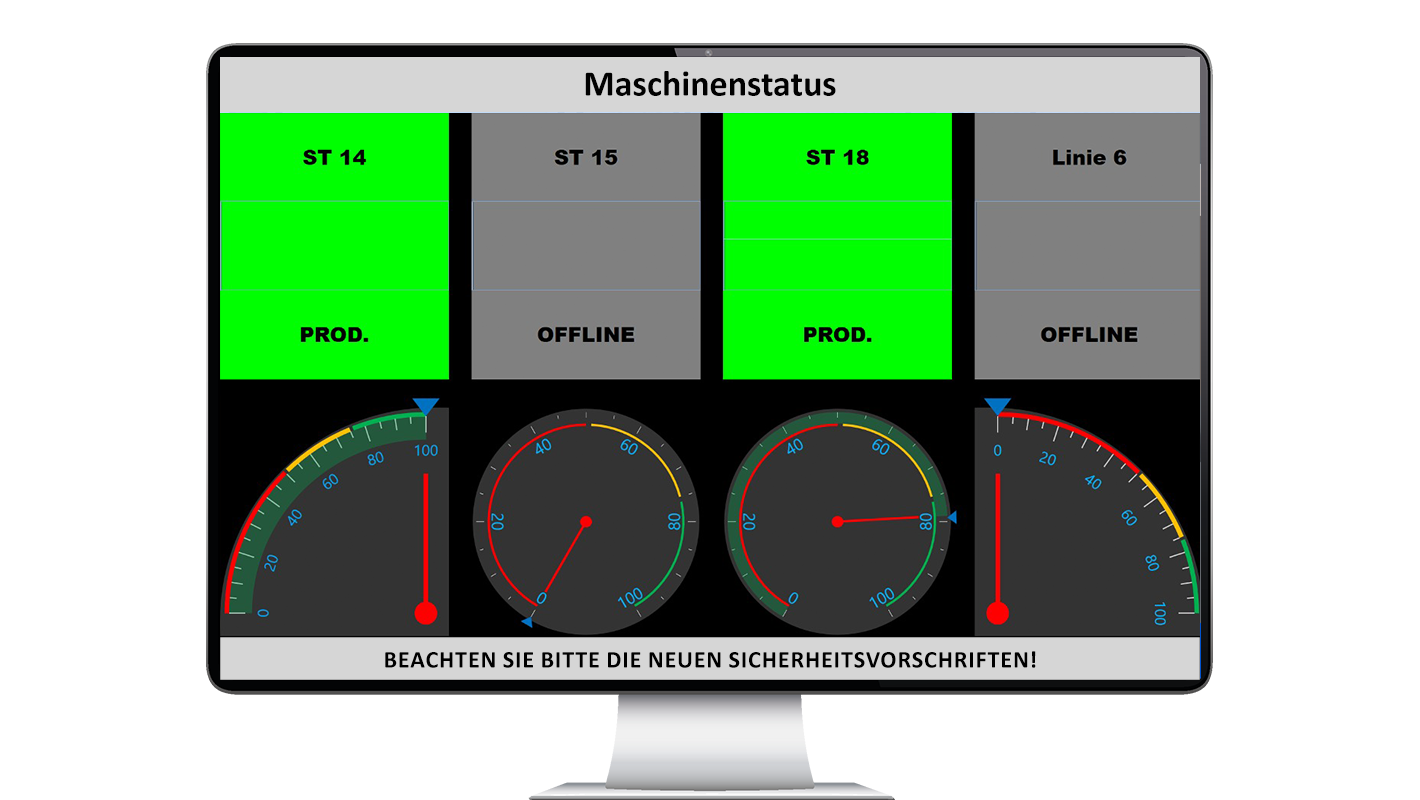
Machine status and utilisation
This monitor shows machine utilisation in real time via tachometers. It also shows the status of four machines - whether they are in production or whether there is a break in production. This allows operators to quickly monitor production and react to any deviations.
Kurzfristig Termin vereinbaren
Vereinbaren Sie kurzfristig einen unverbindlichen Termin und lernen Sie uns kennen. Wir zeigen Ihnen Lösungen zur digitalen Erfassung und Aufbereitung Ihrer Fertigungsdaten. Sie lernen die wichtigsten Vorteile und Funktionen unserer MES Suite PROefficient kennen. Abschließend ermitteln wir, welche Möglichkeiten zur Effizienzsteigerung in Ihrer Produktion möglich sind.
![]() Wie? Präsentation per Webkonferenz
Wie? Präsentation per Webkonferenz
![]() Dauer? Ca. 60-90 Minuten
Dauer? Ca. 60-90 Minuten

